Creating a Data Cube within Zetaris
Permanent Views
In this example, we create a data cube using the virtual view functionality of Zetaris.
The benefits of creating a data cube using a permanent view within Zetaris is that the query utilizes up-to-date data when executed which allows for powerful integration with streaming sources.
The following was executed to create a basic Data Cube.
CREATE DATASOURCE VIEW orders_cube as (
    SELECT COUNT(DISTINCT o_orderkey) as total_customer_orders,  SUM(l_quantity) as total_units_purchased,  ROUND(AVG(o_totalprice), 2) as average_sales_price,  year_c as year,  nation_id, nation
    FROM (
        SELECT o_orderkey,  l_quantity,  o_totalprice,  EXTRACT(
            YEAR
            FROM o_orderdate
        ) as year_c, n_nationkey as nation_id,  n_name as nation
        FROM (
            SELECT *
            FROM AZURE_MSSQL.customer c
            INNER JOIN AZURE_MSSQL.orders o on o.o_custkey = c.c_custkey
            INNER JOIN AZURE_MSSQL.lineitem l on o.o_orderkey = l.l_orderkey
            INNER JOIN AZURE_MSSQL.nation n on n.n_nationkey = c.c_nationkey
        )
    )
    GROUP BY CUBE(year_c, nation_id, nation)
)
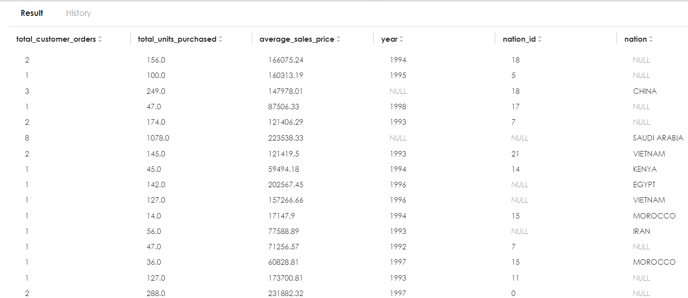
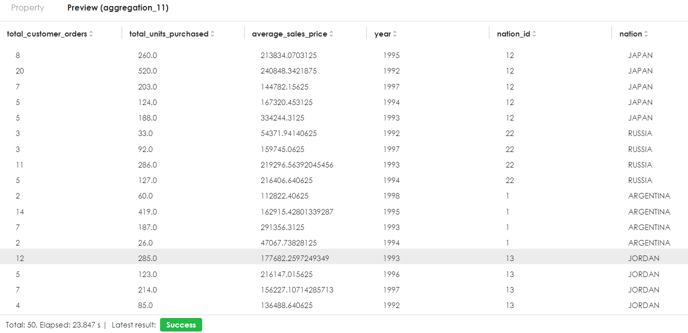
Example output of permanent view
Data Pipelines
Alternatively you can create a data cube within Zetaris using Data Pipelines.
The Benefits of using a data pipeline is that you can separate select queries and data manipulation across multiple pipeline objects for easier visual management of the resources.
For Example the following pipeline was used to create a similar data cube as above shown above.
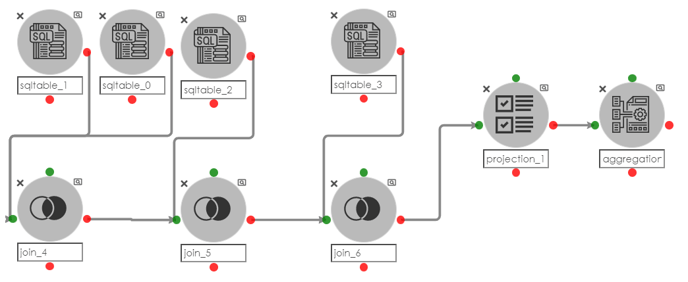
To reproduce the above refer to the below steps.
-
sqltable_0:
SELECT * FROM AZURE_MSSQL.customer
-
sqltable_1:
SELECT *, EXTRACT(YEAR FROM o_orderdate) as year_c FROM AZURE_MSSQL.orders
-
sqltable_2:
SELECT * FROM AZURE_MSSQL.lineitem
-
sqltable_3:
SELECT * FROM AZURE_MSSQL.nation
-
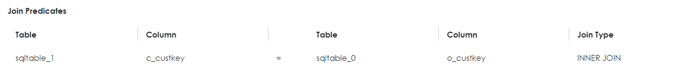
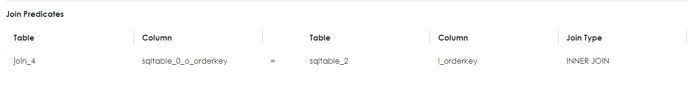
join_4:
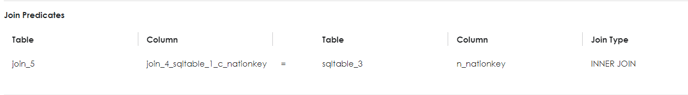
- join_5:
- join_6:
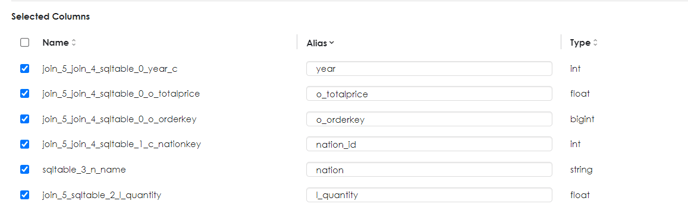
- projection_1:
- aggregation:
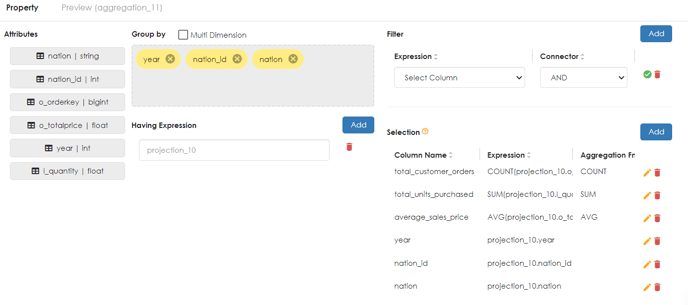
Example preview of Data Pipeline
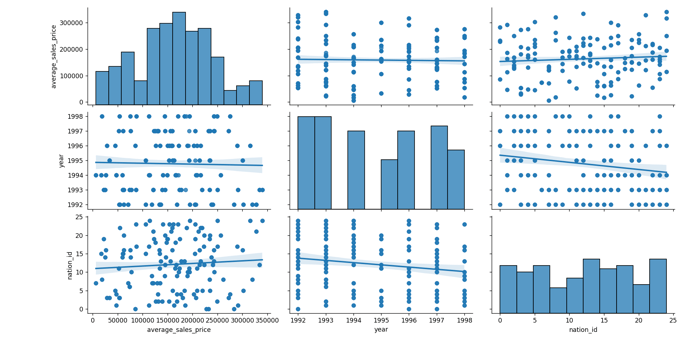
Visualizing a Data Cube
Requirements
-
Python version 3.8+
-
Python Libraries Required:
-
pandas
-
requests
-
json
-
getpass
-
matplotlib.pyplot
-
seaborn
-
-
An accessible machine with a GUI
utilize the pip install function to download the above Python Libraries
Instructions
-
Download the following python scripts here.
-
Encrypt Script
-
Decrypt Script
-
Cube Visualization Script
-
-
Ensure that you’re environment is running the advanced API on version 5 or greater
-
Run the following command to visualize your data cube:
-
python cube_visualization.py <decrypt_key> <alpha-numeric_org_id> <api_url> <permanent_view_name> <aggregated_column> <main_column_1> <main_column_2>
For Example:
python cube_visualization.py zetaris XXXXXXXX apiservice.trial.enterprise.zetaris.com orders_cube average_sales_price year nation_id
-
Example Output