Virtual Pipelining allows you to modify and transform your data for either real-time access for use in down-stream analytic tools, or as a migration tool to move data from source to target. Scenarios for using Virtual Pipeline might be when you want to:
- make structural changes,
- join across multiple clouds and databases,
- create calculated fields,
- aggregate,
- run data quality checks,
- migrate data from source to target, or
- provide real-time access to pipeline source systems
Screen Layout
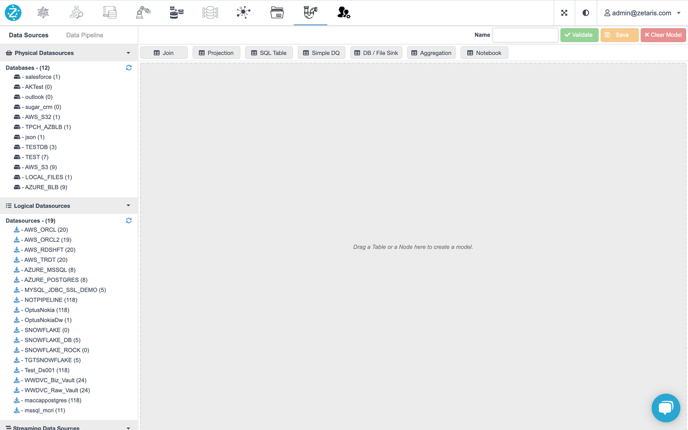
Screen layout
On the top of the screen, it is the navigation bar. Data Sources are listed on the left-hand side while the data pipeline design panel is one the right-hand side.
Left Panel
There are two tabs on the top of left panel, Data Sources & Data Pipeline.
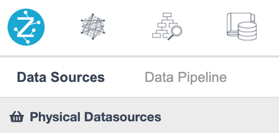
Left panel tabs
Data Sources Tab
The default tab of the left panel is the Data Sources Tab, listed here are 3 different types of datasources, namely, Physical, Logical and Streaming Datasources.
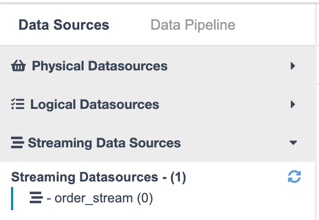
3 types of Data Sources
Endusers can use the button on the right end to expand / collapse the list of datasources. By default those 3 datasource lists are all expanded.
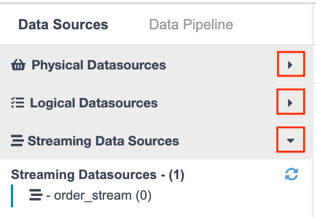
Buttons to expand / collapse
Data Pipelines Tab
The structure of Data Pipeline is two-hierarchy, similar as Datasources (database - table). At first, there are Pipeline Containers. By clicking the name of container, enduser will see the Pipelines inside each container.
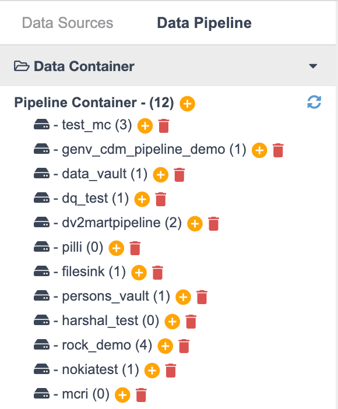
Pipeline Containers
If you want to create a container, click the yellow plus button beside the label Pipeline Containers.
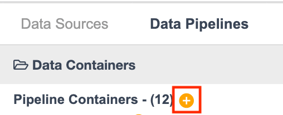
Create Container
If you want to start to build your pipeline inside a specific container, please click the yellow plus button beside the container name. The number in the brackets shows the total count of pipeline containers.
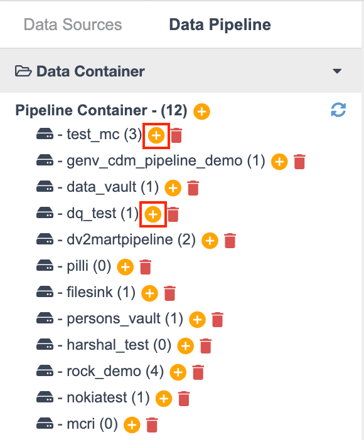
Build Pipeline
Also, the red trash bin button is to delete the whole container, note that all pipelines inside this container would be deleted as well.
After clicking Build button, the user will see the pipeline name appears on the top-right of the screen.
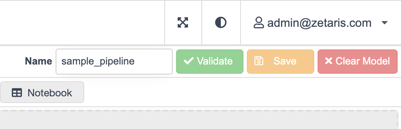
Pipeline Name Edit Box
If you click the specific container where your new pipeline was nested in, the user will see the pipeline name listed without buttons
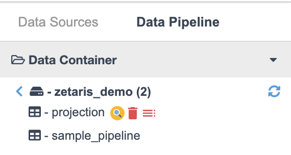
Saved & unsaved
For the existing pipelines, they have three buttons, namely, Preview, Delete and Load.
-
Preview - To preview 10 records of data
-
Delete - To delete this pipeline
-
Load - To restore saved pipeline and visualise it into right design panel
Right Panel - Design Panel
Once the user starts to build a pipeline, the user will be able to drag datasource tables from left hand panel and pipeline node labels, which are left to pipeline name text input and three buttons, Validate, Save & Clear Modal.
There are 7 different types of nodes inside Virtual Data Pipeline. However, Notebook is not available in version 2.1.0. Thus, it would be 6 types of nodes plus the DataSource node (for datasource tables).
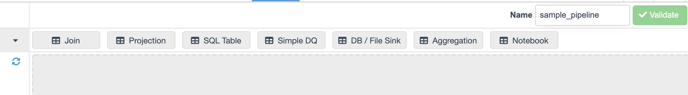
Pipeline Node Labels
Brief Introduction
First and foremost, the top-right buttons
-
Validate - To validate the current pipeline is valid or not. If it is valid, it means the current pipeline is ready to save. This step should be done before saving.
-
Save - To save the entire pipeline
-
Clear Modal - To remove all nodes of current pipeline
Validate & Save button are active only when the number of nodes >= 2, this is because if there is only one node, we cannot call it a “pipeline“. At lease two nodes is a basic principle for validating & saving.
'Clear Model' button is disabled only when there are no nodes on the design canvas.Features of Data Pipeline Nodes
Features of Data Pipeline Nodes
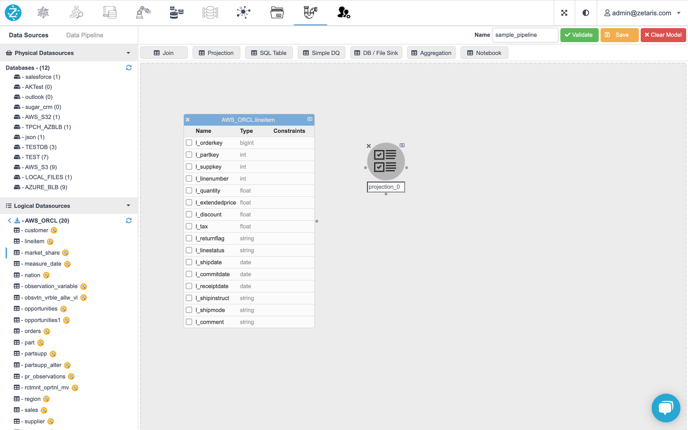
Drag nodes
DataSource Node
DataSource Node is the term for nodes of datasource tables. It is the raw data and serves as the starting point of a data pipeline.
Join Node
By using Join Node, user is able to join two or more nodes together by setting up join predicates between them. Please be aware that the order of join predicates is crucial. Besides, filter & orderBy are also the optional for Join Node.
Projection Node
Projection Node truncates the columns from its source node, as well as adds new customised columns (we call them virtual columns). Also, the user is able to apply filter (you can regard it as WHERE clause) and orderBy to Projection Node.
SQL Table Node
By default, user drags DataSource Nodes (tables) from Left Panel at the first step to build a pipeline. However, there is another way to fetch the raw data of a pipeline, that is, from analysing a SQL statement. User writes a single query (e.g. SELECT c_name FROM aws_orcl.customer, cannot be multiple queries) inside the Editor Panel and clicks “Infer“ button, then it will returns inferences (inferred columns) by analysing this SQL.
Simple DQ Node
Pipeline can also support simple Data Quality as well. Amazon Deequ is integrated in this node, and user can make some assertions to check if the target dataset (node) meet the conditions. Details see NDP Simple DQ guide
DB / File Sink Node
After a pipeline is created, the data of this pipeline is saved into meta_store of Lightning backend. Here is a question, how do the user save or download the data of pipeline ? This is the reason why we have DB / File Sink. This node enables user to save the result data of pipeline by providing jdbc connection information or AWS s3 / azure blob credentials, or saving directly into NDP File System or local machine. It is simple and easy for users to handle result data into other places.
Aggregation Node
Aggregation Node contains a variety of aggregate functions used in normal SQL statement.
-
User should set up the column(s) to be aggregated (groupBy columns).
-
Having expression is similar to HAVING clause in SQL and it is optional.
-
Filter is another optional part, same as the filters in Projection & Join node
-
Selection is the output columns of Aggregation node. If user does not add any columns in this section and then preview this Aggregation node, it will return no data to display as there are no outputs defined.
-
When picking columns in Aggregation selection part.
-
If this column is one of the groupBy columns, the user cannot apply aggregate functions on it.
-
If this column is not the groupBy columns, the user must apply aggregate functions on it.
-