Data Quality & Exception Management - Technical implementation
This article covers the automation of the Data Quality rules within Zetaris.
This page details the automation of the Data Quality rules within Lightning. The implementation enables the user to add new DQ rules onto the objects/tables, retrieve DQ results for the applied rules and the DQ Exception report in Lightning. The output of this DQ analysis is shown on the DQ Tableau dashboard which enables the user to visually track, analyze, and display key performance indicators metrics to understand the quality of data on a daily basis. This will enable the user to know the exact record for the objects where the applied DQ rule is failing.
As part of automation, the user will be able to add new DQ rules/delete the existing DQ rules by just including that information within the Lightning NDP Filestore system.
Prerequisite:
Please note that requested access to
GITHUB links will be required in order access files.
Data Quality Pipelines
Lightning provides the feature of a Data Quality pipeline that automatically calculates the results based on different DQ dimensions.
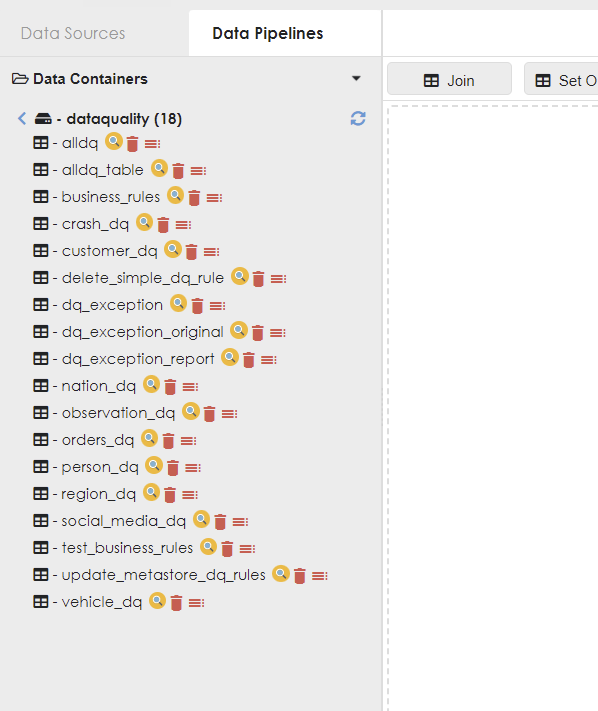
The following image shows the DQ pipelines within the Data Quality container.

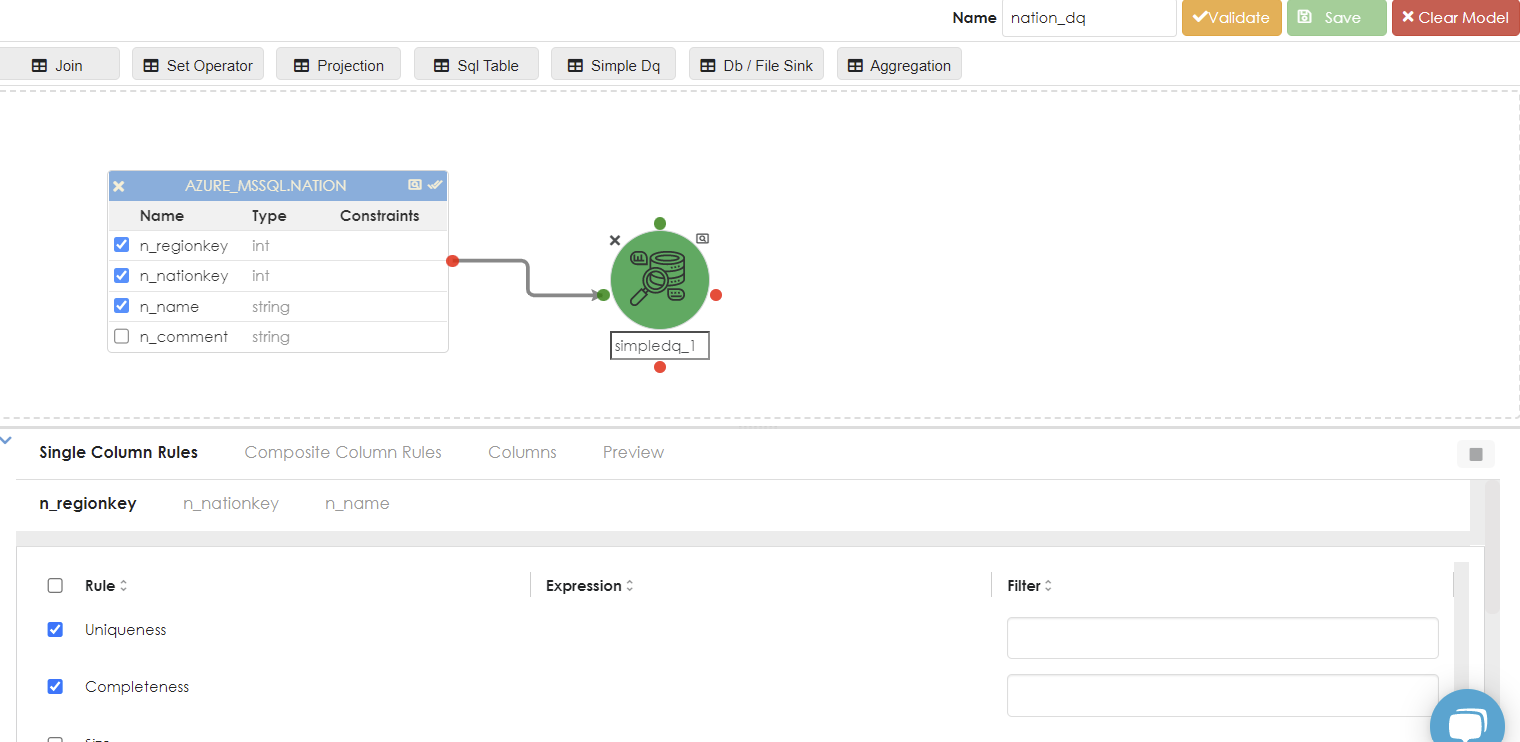
The pipelines with the suffix ‘_dq’ are the data quality pipelines created for a specific table. For example:- ‘Crash_dq’, ‘Customer_dq', nation_dq’ etc. Each of these pipelines is created to apply the DQ rules to a specific table. These pipelines make use of the Data quality node feature that automatically calculates the DQ results for that specific table. An example of one of these pipelines (nation_dq):


This is how the DQ pipelines are created for each object.
‘Alldq_Table’ Pipeline: It performs the union of all of these DQ pipelines and provides the aggregate result of this DQ results on all of these objects. The result of this pipeline is stored in the ‘alldq’ Table within the RDS.
The result for 'select * from rds.alldq' is as follows:

Example for the DQ Result stored in Lightning
DQ Exception Report - Exception report at the record level for DQ Rule failure
The ‘dq_exception_details’ table provides the DQ exception report for the applied DQ rules on the objects. It enables the user to know the exact record for the objects where the DQ rule is failing. It stores the value of the primary key of that record within the ‘spid’ column where the DQ rule failed. DQ batch runs on a daily basis and stores the exception report in this table that helps the user to know the DQ failure at the record level.

Example for the DQ Exception Result stored in Lightning
DQ Tableau Report - Visual representation of key performance metrics
The dataquality_data_mart contains all objects that will be used for the DQ exception reporting in the Tableau dashboard.
This dashboard makes use of ‘alldq' and 'dq_exception_details’ objects (mentioned in the above sections) to represent the data quality results through different visuals. It enables the user to visually track, analyze, and display key performance indicators metrics via the dashboard. The report consists of the following dashboards:
-
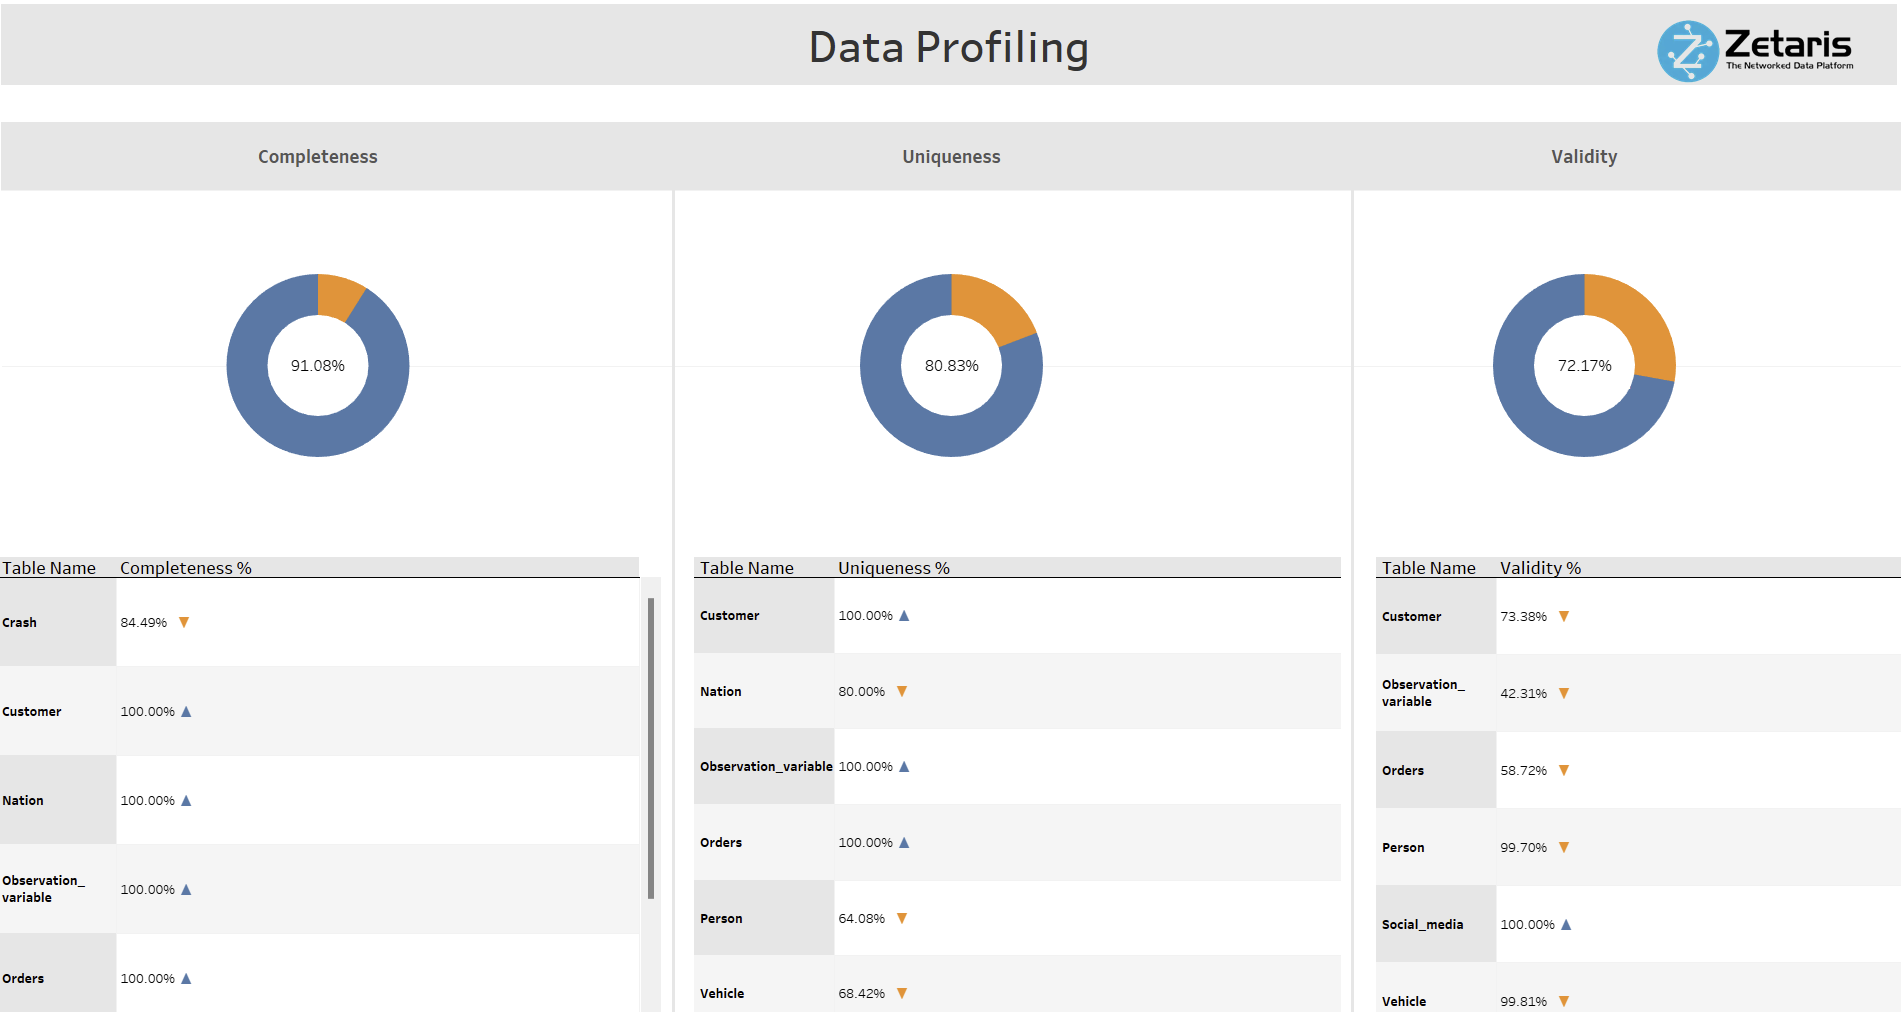
Data Profiling Dashboard: It acts as the home page of the DQ Tableau Report. Here the user can view the DQ results based on three DQ dimensions (Completeness, Uniqueness, and Validity).
-
Users can view the overall score of each of the DQ dimensions through the doughnut charts. These charts are clickable to navigate to their respective DQ exception report
-
Users can view the overall score of each of the objects for these three dimensions
-
Users can drill down the tables and view these scores for their respective columns
-
 Data Profiling Dashboard(Home Page)
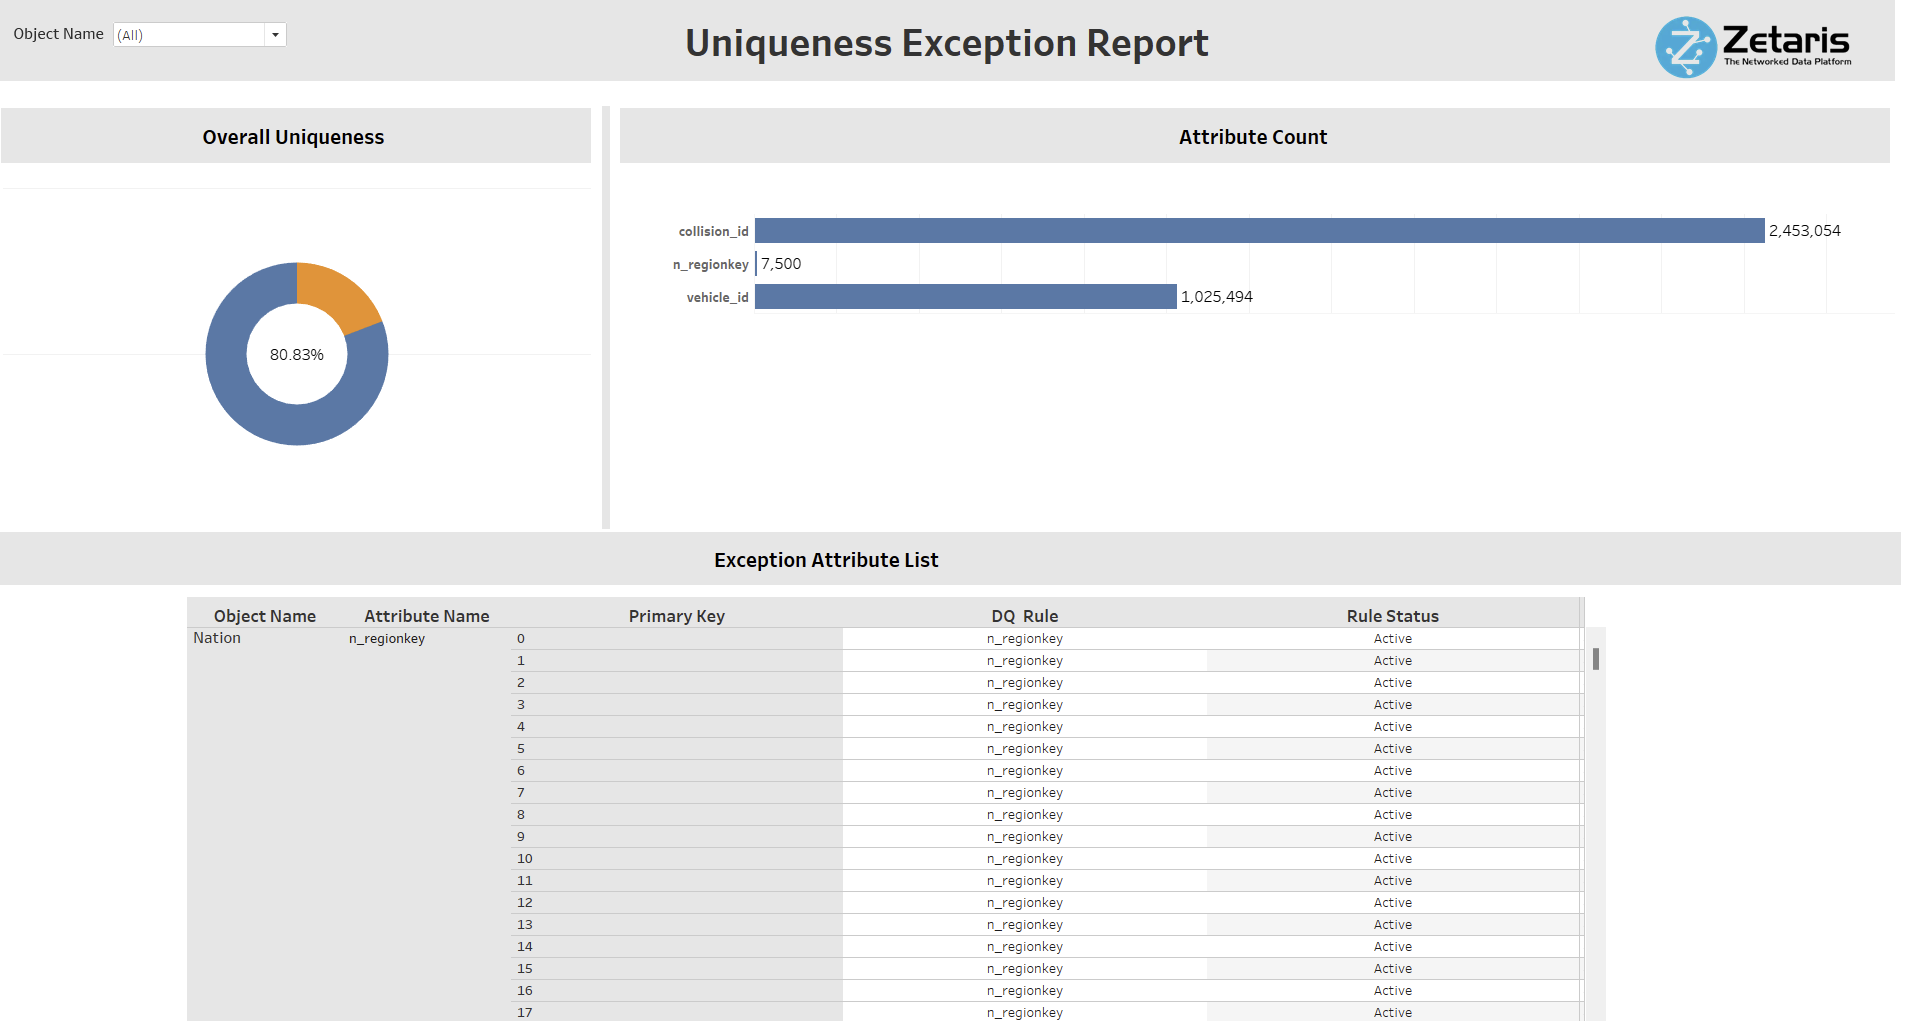
Uniqueness Exception Report: When the user clicks on the Uniqueness doughnut charts(on the Data Profiling home page), the user will be navigated to the ‘Uniqueness Exception Report' page. This dashboard will show the following information:
-
Overall Uniqueness: It shows the overall uniqueness score for the data.
-
Attribute Count: It represents the record count where the applied DQ rule is failing.
-
Exception Attribute List: It shows the attributes list at the record level for each object where the DQ rule failed. This will help the user to grab the primary key of that record where the DQ rule failed and fix the issue.

There are two other exception reports for ‘Completeness’ & 'Validity’ to represent the corresponding exception report similar to Uniqueness Exception Report.
Automation of DQ rules - Easy way of adding/deleting the DQ Rules in Lightning
The Data Quality implementation allows the user to add/ delete the DQ rules by just populating that information within the ‘Business_Rules.csv’ file within the Lightning NDP file store and the DQ automated system will automatically consider those rules to provide the DQ results.
-
Addition of new DQ Rules:
The DQ implementation allows the user to add new rules to the objects/tables. To perform this user needs to add these rules in a CSV file (Business_Rules.csv) and store them in the Lightning NDP File store system. The path for storing these new rules within the NDP file store system:/file-store/DQ_EXTERNAL_FILES

‘Business_Rules.csv’ file within the NDP file system
Once the user adds the rules within the ‘Business_Rules.csv’ file, these new rules will automatically become part of the DQ analysis from the next day as there is nightly DQ batch execution. The newly added DQ rule needs to have ‘Y' as the value of the 'rule_active’ column.
An example of adding/deleting the DQ rules via Lightning NDP File system.

- Deleting/Inactivating the existing DQ Rule:
If the user needs to inactivate the existing DQ rule, the user needs to add that particular DQ rule with ‘I' as the value of the 'rule_active’ column. An example of inactivating the existing rule is shown in the above image.